Ready to automate your workflows?
Discover how we can transform your complex challenges into intelligent execution.
The Crime
Periodic freezes in a closed customer installation, eight months of looking for clues and nothing in a log file. Not a sausage. Not even a dodgy user.
So here we are with an application that is over fifteen years old with hundreds of similar installs without this problem. A WinForms desktop app with a SQL Server database with zero direct access and zero clues. Where do we start, Watson?
A long running database query? The UI thread being tied up performing some IO? You are looking in the wrong place, my friend - those would be far too obvious; the dev team who know this app inside out will have already been there - no, we need to go deeper.
Let’s just cut straight to the answer to highlight how bonkers obscure this bug was.
The bug was caused by the desktop background being changed to a solid colour. Yep, you read that right.
Do you want to find out how we found this in just a couple of hours? If so, read on - this is where we get technical.
Introducing the memory dump
This isn’t a place that many developers will go looking but from our experience, it’s the best place to see the internal workings of the application at the point the fault occurs.
As this is a WinForms application running on Windows, we have an exported memory dump. You have to grab this from the task manager in Windows the moment the problem occurs.
Keep in mind that this production environment was heavily locked down and only the internal IT team had any access to it. You know, just to keep things interesting.
Now to get out the magnifying glass, in true Sherlock style. Before you begin, it’s important to have an objective, because it’s easy to get distracted and dragged down a tangential rabbit hole in a memory dump file.
In this case, our objective was to:
Reproduce the issue and cause the application to freeze in exactly the same way on a developer machine.
So let’s jump right in, look at the call stack, and find out where the application is stuck.
The memory dump can be loaded into Visual Studio and debugged (Debug with Managed Only). This won’t be debugged in the normal sense where you can step through the running application. You will get the state of the application at a frozen point in time, which will include any variable state on the stack and any objects in the heap.
Be sure to load in the symbols for the exact version of the application running.
Enter stage right, the Frozen Call Stack
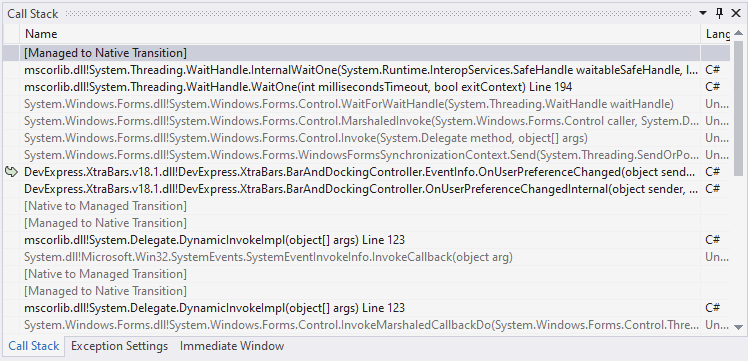
Debugging the memory dump highlighted the frozen code call stack; this can be seen in the following screenshot:

Don’t worry, there’s nothing here that leaks any sensitive information or insights into this application.
Time to get the tweezers out, pull at the thread and decompile that XtraBars component. The frozen code pointed to two method calls executed in XtraBars BarAndDockingController. Using our old friend dotPeek, from JetBrains, we decompiled the referenced assembly and generated a Debug Symbol (pdb) file.
After loading in the pdb file to the current debug session, it revealed the following source code:
Ah-ha, Watson, we’re on to something here! This tells us that the code was stuck on a synchronisation context, which could mean something user interface-related was not executing against the right thread.
Let’s have a look at what Google can tell us about applications hanging OnUserPreferenceChanged.
Another clue: a support ticket on the DevExpress support centre, where someone had posted a similar issue happening to them.
Not so fast, Watson, this could be a red herring! Their particular problem was related to pdf generation, but it did give us an indication there’s an issue with the DevExpress components.
This shows that we need to look a bit closer at the code in question. We could see the event handler for user preference changed system event is an event being fired from the operating system. The DevExpress user interface control was responding to the event.

The ‘Colour’ category was identified as the data we needed. Let’s take a look at the UserPreferenceCategory enum for a full list of the fields. Ah-ha! This is the one we’re interested in!

We’re on the right track, this seems more familiar!
Now we can attempt to reproduce the issue and prove our hypothesis. We know the operating system was firing an event that the application DevExpress control was freezing on - all it took was finding which one.
We realised we needed to trap the culprit! We created a tiny test application to capture the event category of “Colour’ so that we could poke the settings until it happened.

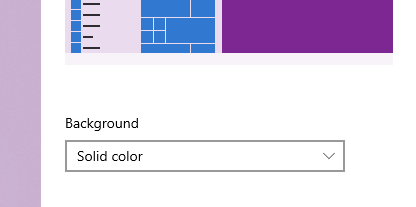
Trial and error, keep poking until you capture the event, Watson! After running plenty of different personalisation settings, we found switching to a solid colour background caused the “Colour” category event to fire:

I think we might have found something, Watson! Let’s see if it does what we expect.
Sure enough the application froze in exactly the same way as the production environment when we changed the background to a solid colour in the settings.
A question for the IT team: do you happen to have a group policy of changing the background of your machines to a solid colour? You do? How interesting. May we suggest that you alter that policy until a patch is released?

Our work here is done. Case closed.
It’s simple when you know how, but not so simple to work out. Next time you have a really tricky problem to solve, try taking a look at the memory dump and digging deeper into the code.
You never know, you might get the nickname Sherlock ;)
More from our team
Keep Reading

The Connected Organisation - Insight Beyond the Shop Floor
Discover how to bridge the gap between the shop floor and the boardroom. Learn how Agentic AI transforms disconnected manufacturing data into a unified, actionable connected organisation.

The Silver Tsunami - Fighting the Tide
Discover how to capture and operationalise tribal knowledge before your most experienced workers retire. Learn how Agentic AI helps manufacturers combat the Silver Tsunami.

AI Buyers Guide for Manufacturing
A comprehensive guide for manufacturing leaders looking to purchase and implement AI solutions, covering key considerations, ROI, and how to avoid common pitfalls.
Diving deeper into Razor
Your Next Move

AI Activation Plus
Uniting comprehensive strategic understanding, clear roadmap planning, and immediate action. AI Activation Plus delivers a rigorous readiness assessment and immediately builds a working Proof of Value.

AI Activation
Bridge the gap between AI ambition and operational reality. Rapidly identify high-value opportunities and leave with a clear, prioritised roadmap you can act on.

Technology Strategy & Digital Roadmapping
Unlock your business success with a robust technology strategy. Our consultants provide the technical expert vision needed to thrive and outpace the competition.
